How drone visuals help project teams spot delays and issues early
Which drone visuals show the story behind a project's progress?
When a construction or infrastructure project runs late, the first sign is rarely a formal report. It shows up in the way materials sit untouched, or in a stretch of earth that should have been graded but isn't. Project teams that rely on regular site visits sometimes catch these clues; those that don't can miss them for weeks. Drone progress tracking has become the tool that turns those subtle clues into clear, date-stamped evidence. But not all drone visuals are equally useful. Knowing which ones to use and how to read them makes the difference between spotting a delay and discovering it too late.
Orthomosaics: the overview that never lies
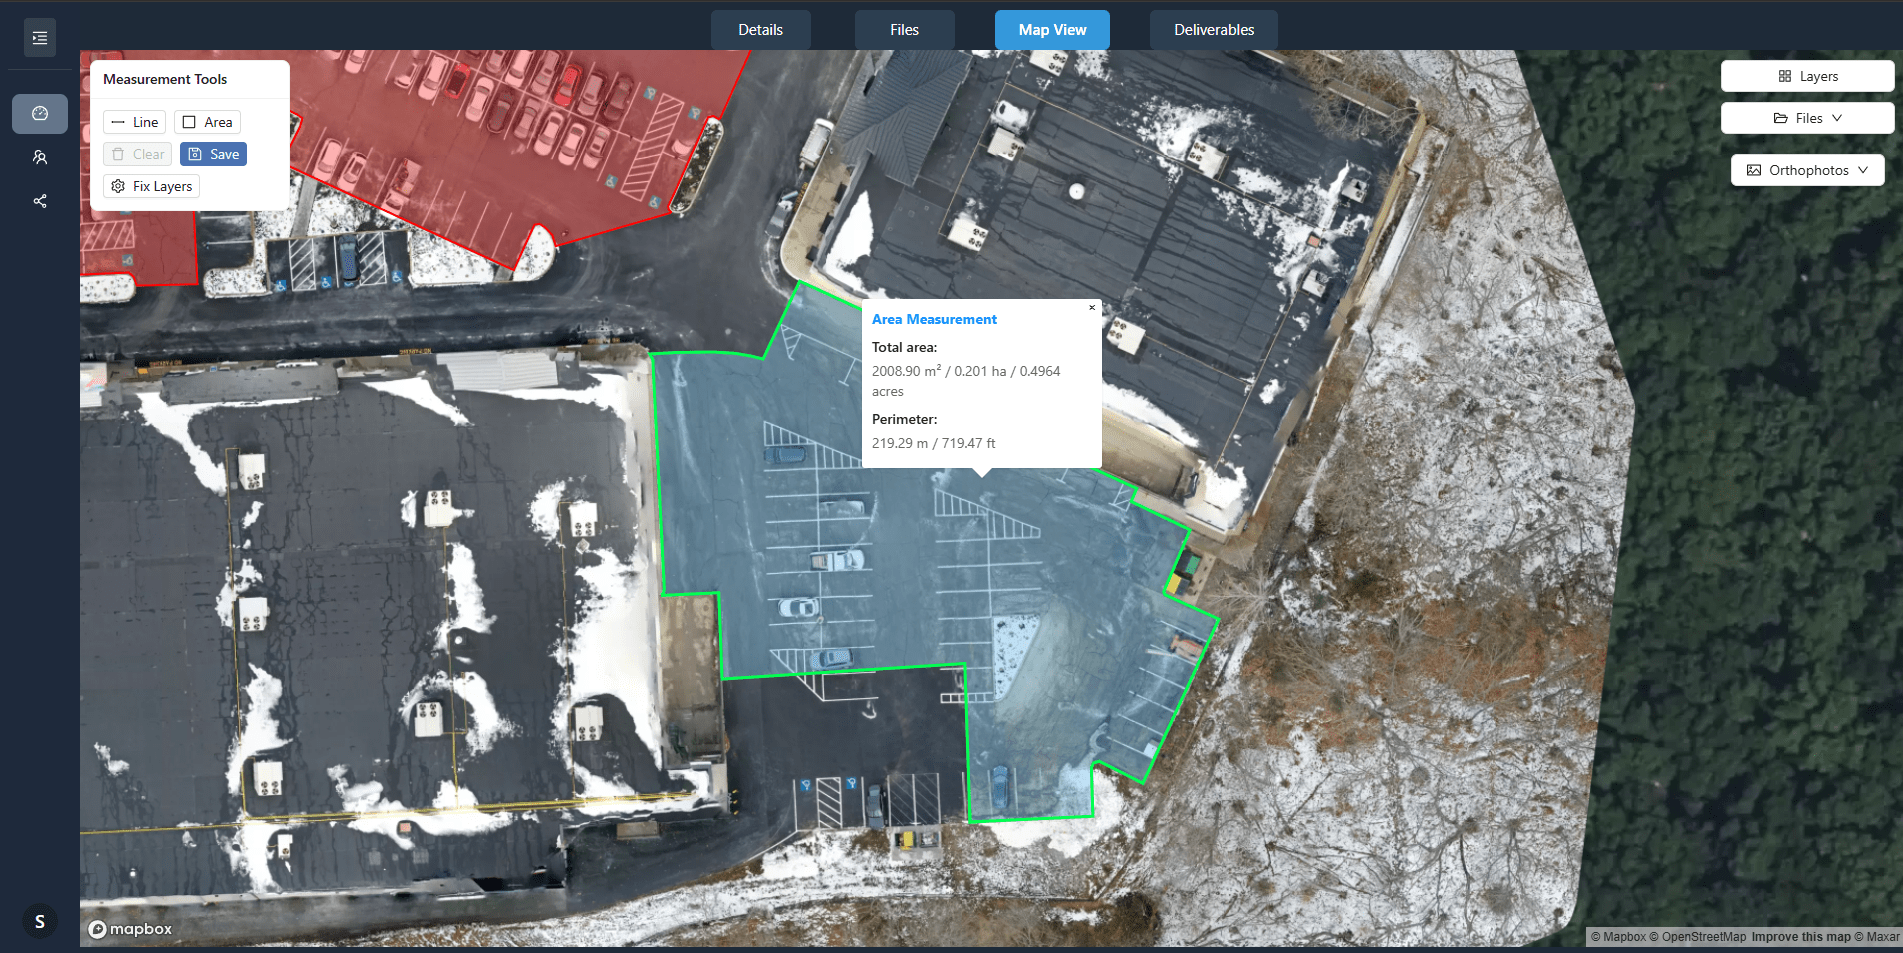
An orthomosaic is a stitched-together aerial image that has been geometrically corrected so every point corresponds to a real-world coordinate. Unlike a simple drone photo, an orthomosaic lets you measure distances and areas directly. For progress tracking, that means you can compare the footprint of a building foundation on one flight date with its footprint two weeks earlier. If the outline hasn't changed, work has stalled. The same orthomosaic can reveal stockpile volumes, vehicle tracks, and areas where drainage is pooling. Because the image is georeferenced, you can overlay it with the project's CAD plan and see exactly where reality diverges from the schedule. Teams that review orthomosaics weekly catch mismatches between what was designed and what is being built while the concrete is still wet, not after it has cured.
Change detection layers: highlighting what moved
Comparing two orthomosaics by eye works, but it is slow. Change detection software automates the process by subtracting one image from another and highlighting the pixels that differ. The result is a visual that shows exactly which areas have been excavated, filled, paved or built on between flights. A project manager can open a change detection layer and see at a glance whether the north-west corner of the site has been worked since the last capture. If the layer shows no change in an area that should have progressed, that is a red flag. Change detection also helps with quality control. If a trench appears where none was planned, or if a stockpile has shrunk more than expected, the visual flags it. The data is objective; it does not rely on a foreman's memory or a daily log that may be incomplete.
3D models and point clouds: volume and elevation without guesswork
Some delays happen below the surface. A site that looks flat in a standard photo may have subtle elevation changes that slow down grading or foundation work. Drone progress tracking using 3D point clouds or digital surface models reveals those changes. A point cloud is a dense set of measured points in three-dimensional space. Processed into a surface model, it shows the exact height of every part of the site. Compare two surface models from different flight dates, and you get a cut-and-fill map: the volume of earth removed or added. If the model shows that a required cut has barely advanced, the project is falling behind schedule, even if the surface looks busy. Volume measurements from point clouds are also used to track material stockpiles. If the pile of crushed stone is supposed to shrink by a certain amount each week but the model shows almost no change, the supply chain or the placement crew is behind. That kind of delay, invisible to a ground-level observer, becomes obvious in the data.
Timeline composites: the whole project in one view
A timeline composite stacks multiple orthomosaics or surface models by date, often as a slider or an animated sequence. Scrolling through the timeline shows the entire construction sequence in fast-forward. For spotting delays, the power of a timeline composite is that it puts the project's rhythm on display. A team can see whether the pace of work has slowed across the whole site or only in one area. They can also compare the actual timeline to the planned timeline by overlaying milestones on the composite. If the composite shows that the second floor slab should have been poured three weeks ago but the first floor is still not complete, the delay is visible and measurable. Timeline composites also help with communication. When a stakeholder asks why the project is behind, a quick playback of the aerial timeline answers the question more clearly than a written report.
Site annotations: turning visuals into action items
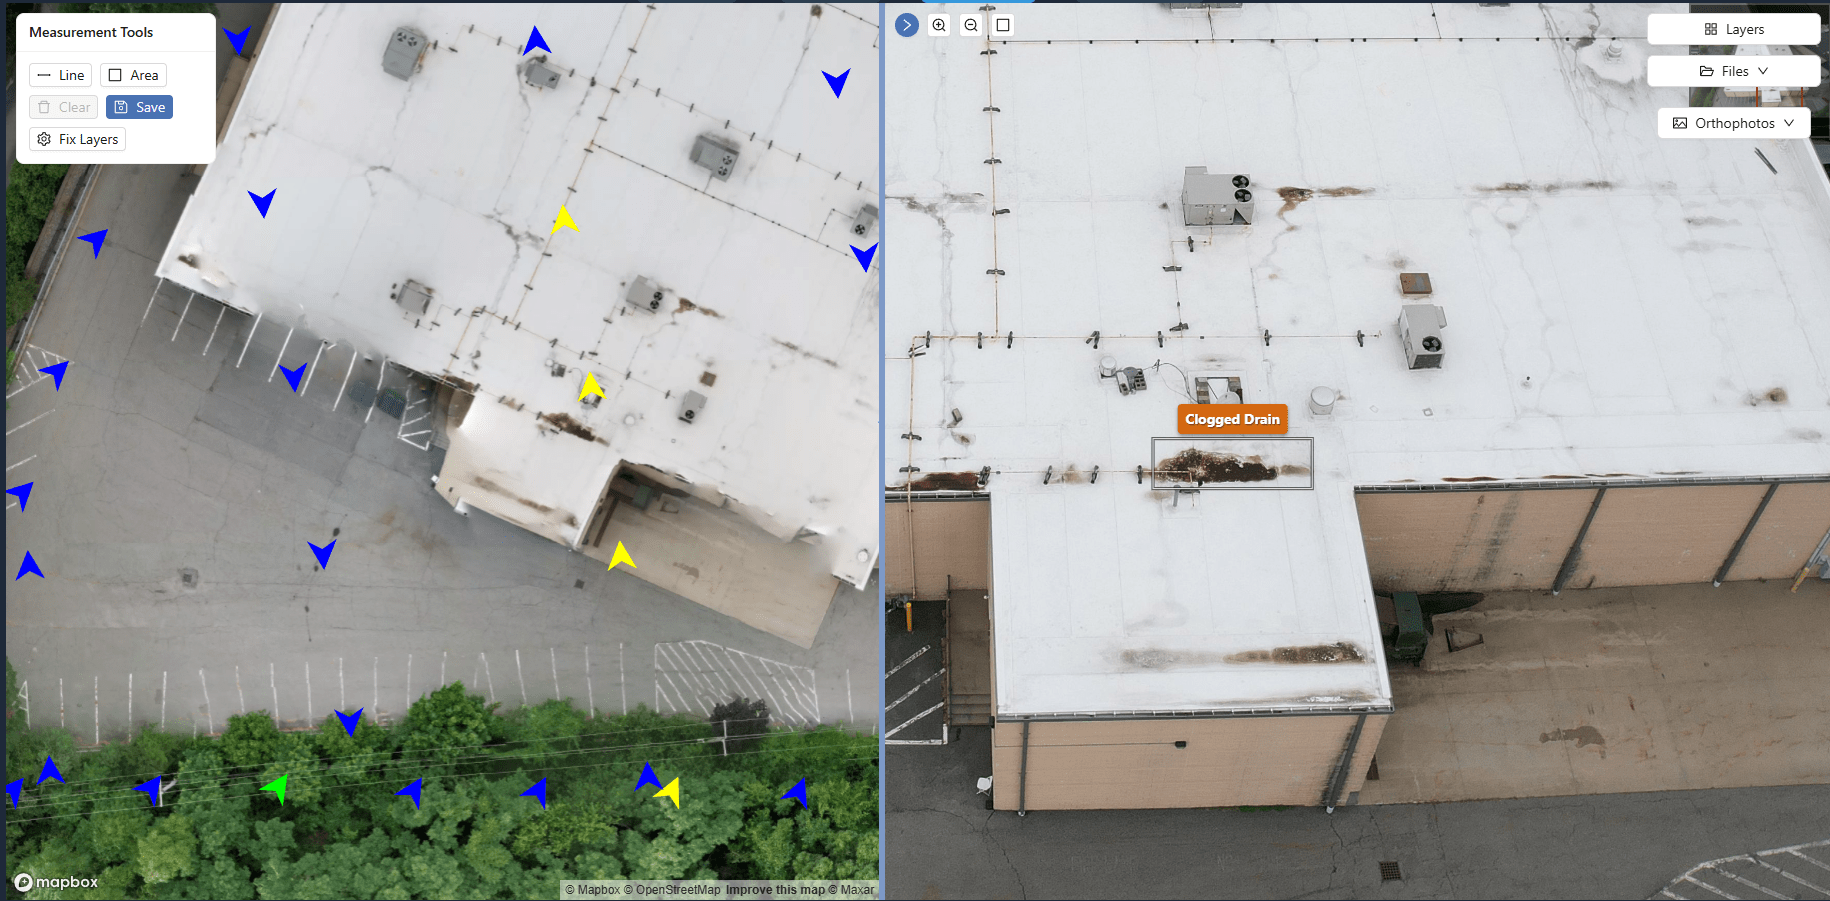
A drone image or model is only as useful as the decisions it drives. Site annotation tools let project teams mark up visuals with notes, arrows, pins, and colour codes. A team reviewing the latest orthomosaic can draw a circle around a section where the rebar hasn't been placed and assign a note to the site supervisor. The annotation becomes part of the project record, linked to the flight date and the specific location. Over time, a pattern of unresolved annotations can itself signal a systemic delay. If the same area gets flagged week after week, the team knows that the issue is not just a one-off slip but a persistent bottleneck. Annotation layers also help coordinate subcontractors. A steel erector can see exactly where the concrete crew left off, because the previous week's annotation shows the pour limit. That clarity prevents the kind of back-and-forth that eats up days on a busy site.
Choosing the right visual for the right question
The most effective drone progress tracking uses a combination of these visuals, not just one. An orthomosaic gives the big picture. Change detection layers highlight what actually changed. Surface models show elevation and volume. Timeline composites reveal the pace. Annotations turn observations into action. The trick is to match the visual to the question. If the question is "Has the earthwork started in Sector C?", a change detection layer answers it in seconds. If the question is "Is the building envelope matching the design?", overlay the orthomosaic on the CAD plan. If the question is "How much material is left in the stockpile?", run a volume calculation from the point cloud. A project manager who knows which visual to use when can spot a problem early, sometimes before the crew on the ground realises there is one. That early warning is the real value of drone data. It is not about taking pretty pictures from above; it is about measuring progress objectively and consistently, flight after flight.
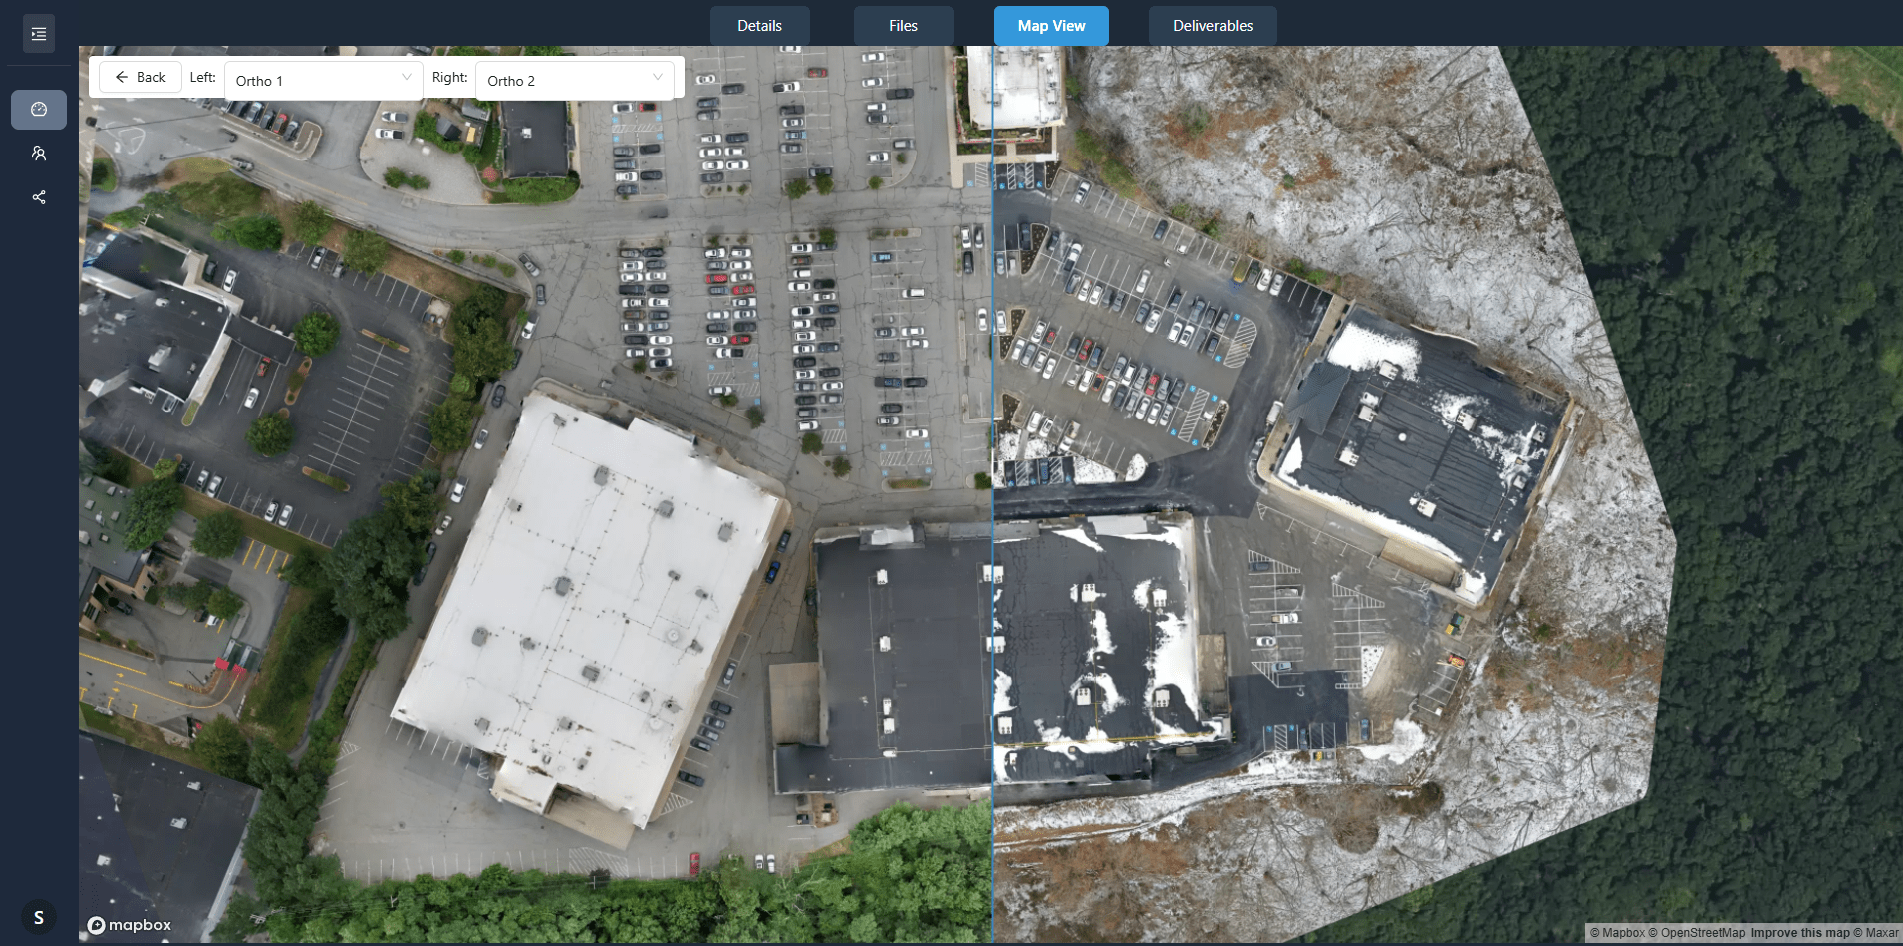
Platforms like those offered through nationaldroneservices.net help teams organise these visuals so they can be compared side by side across flight dates. When every capture is stored in one place and aligned to the same coordinate system, the comparisons become routine. A team can open the latest orthomosaic, drag the timeline slider back two weeks, and see exactly what has changed. That routine check, done weekly, catches the small delays that compound into big ones. It also builds a record that protects the project owner if a dispute arises over who caused a delay. The visuals do not lie; they show what was there on each flight date.
Making progress tracking part of the weekly rhythm
Drone progress tracking works best when it becomes a habit, not a response to trouble. The teams that get the most value schedule a regular capture on the same day each week, process the data quickly, and review the results in a short meeting. They do not wait for a missed deadline to look at the aerial imagery. They look because the imagery tells them whether the deadline is still realistic. Over time, they build a library of visuals that shows the entire life of the project. That library becomes a reference for future bids, for training, and for refining the way the team estimates time and materials. The visuals are not just a record of what happened; they are a tool for getting better at predicting what will happen next.
For project teams that are new to drone data, the key is to start simple. Pick one visual type, orthomosaics or change detection, and review it weekly for a month. Learn to read the signs: the unchanged footprint, the unmoved stockpile, the ungraded slope. Once that becomes second nature, add the next visual. Surface models for volume. Timeline composites for pace. Annotations for communication. Each layer adds depth to the understanding of the project's real status. The goal is not to have the fanciest data set; it is to have the clearest picture of what is happening on the ground. And that picture, updated regularly, is what lets a project team spot delays while there is still time to do something about them.
Reliable drone data platforms, such as those referenced by nationaldroneservices.net, provide the structure needed to turn raw captures into actionable progress visuals. With the right visuals and a consistent review process, project teams stop reacting to delays and start seeing them coming.